Why F1 Engines Could Rev to 20,000 rpm (and Why Yours Can't)
A 39.75 mm stroke is the whole trick. We ran the Cosworth CA2006 against its nine-point published power curve and landed within 1.9% at the rated point.
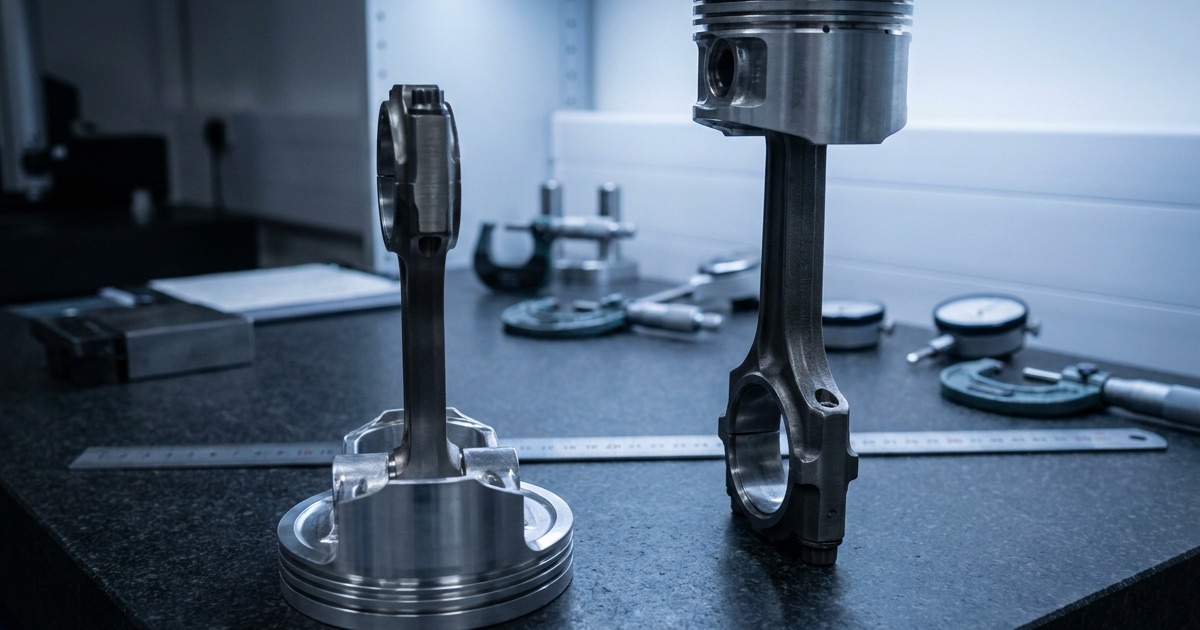
The first time we put a 2006-spec Formula One V8 into the simulator, it made −72 N·m at 19,250 rpm. Negative torque. The engine could not turn itself at the speed its manufacturer rated it, let alone drive a car. Every dimension was right, taken from Cosworth's own figures, and the model still said the thing was impossible.
The geometry was not the problem. Our friction model was: it charged against engine speed, so a 19,250 rpm engine looked like a road car being spun to destruction. What it should have charged against is how fast the pistons are actually moving — and that number is the whole reason a Formula One engine can do something your car cannot.
Key Takeaways
- The limit is not rpm. It is mean piston speed, and it equals 2 × stroke × rpm ÷ 60. The Cosworth CA2006's 39.75 mm stroke puts 25.51 m/s (computed) on the table at 19,250 rpm.
- A Chevrolet LS7, with a 101.6 mm stroke, is already at 23.7 m/s (computed) at its 7,000 rpm redline. It is doing nearly the same violence to its pistons at less than 40% of the revs.
- Cosworth published 755 bhp @ 19,250 rpm and 214.4 lb·ft (290.7 N·m) @ 17,000. Our preset, built on the published geometry, measures 743.19 hp @ 19,250 — 1.6% under, at exactly the rated speed.
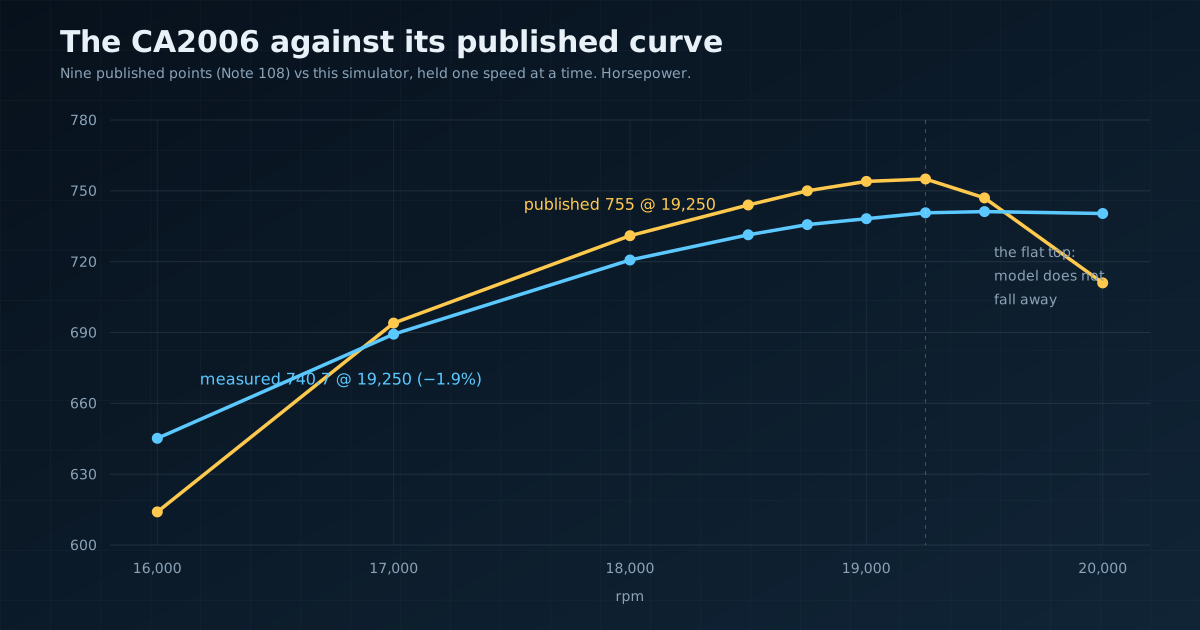
- Against the nine published curve points from 16,000 to 20,000 rpm, held one speed at a time, eight of nine land inside 5%, and the rated point is −1.9%.
- Short stroke is the enabler, not the answer. Taking the 98 mm bore the rules allow inside 2,400 cc is what leaves 39.75 mm of stroke, and that bore is where the valve area — and therefore the breathing at 19,000 rpm — comes from.
On this page: Quick answer · Piston speed is the wall · The engine that did it · Why short stroke buys breathing · What stops a road engine · What we cannot measure · Try it · FAQ · How these numbers were made
Quick Answer: Why They Could, and You Can't
Because their pistons barely move. Engine speed is not what tears an engine apart; the speed of the piston up and down the bore is, and that depends on stroke as much as on rpm. Formula One's 2006 rules capped displacement at 2,400 cc and mandated eight cylinders, so designers spent the entire allowance on bore and left almost nothing for stroke — 39.75 mm in the Cosworth CA2006, about the length of your thumb from tip to first knuckle.
Your engine's stroke is more than twice as long. Give it 19,000 rpm and its pistons would be doing something no metal survives.
Piston Speed Is the Wall, Not RPM
Mean piston speed is the average velocity of a piston over one stroke, and it comes from two numbers:
MPS (m/s) = 2 × stroke (m) × rpm / 60
The 2 is there because the piston covers the stroke twice per revolution, down and back up. Nothing about cylinder count, displacement or bore appears in it. Stroke and rpm, and that is all.
Run the two engines through it:
| Cosworth CA2006 | Chevrolet LS7 | |
|---|---|---|
| Stroke | 39.75 mm | 101.6 mm |
| Bore | 98.0 mm | 104.8 mm |
| Rated speed / redline | 19,250 rpm (rated power) | 7,000 rpm (redline) |
| Mean piston speed at that speed | 25.5 m/s | 23.7 m/s |
| Published output | 755 bhp @ 19,250 rpm | 505 hp @ 6,300 rpm |
Both piston speeds are computed from published bore and stroke, not manufacturer figures. 19,250 rpm is the speed Cosworth rated the engine at; it ran past 20,000 on track, where the same arithmetic gives 26.5 m/s.
The revs differ by a factor of 2.75. The piston speeds differ by 8%. That is the whole story in one row: the F1 engine is not asking more of its pistons than a big American V8 already asks of its own, and it collects 2.75 times as many power strokes per minute for the same trouble.
Piston speed is what sets the inertial load on the rod. Peak acceleration near top dead centre scales with stroke and with the square of engine speed, and the rod carries all of it in tension, twice per revolution. Race engines live at the top of that scale: our own preset linter fires a piston-speed warning at the CA2006 the moment you load it, and the 25.5 m/s it warns about is the same figure Note 108's author computed for the real engine.
The corollary is what makes this useful rather than trivia. If you want more rpm, you do not need better metal first. You need a shorter stroke. Metallurgy raises the ceiling; geometry decides how much of it you get to use.
The Engine That Did It: 98 mm of Bore Against 40 of Stroke
The 2006 Formula One regulations are unusually prescriptive, and they wrote this engine's shape for it. From the FIA's own text (2006 Formula One Technical Regulations):
- Article 5.1.2 — "engine capacity must not exceed 2400 cc."
- Article 5.1.4 — "All engines must have 8 cylinders arranged in a 90º 'V' configuration."
- Article 5.4.1 — "Cylinder bore diameter may not exceed 98mm."
- Article 19.3 — petrol between 95.0 and 102.0 RON.
Read those together and the design is nearly forced. Take the maximum bore, because bore is free breathing and costs no piston speed. Eight of them at 98 mm, filling 2,400 cc, leaves 39.75 mm of stroke and no choices left to make. That is what Cosworth built, and the figures below are theirs, from a technical note that marks which numbers came from the manufacturer and which are the author's arithmetic (grandprixengines.co.uk, Note 108, Ian Bamsey):
| Cosworth's published figures | |
|---|---|
| Bore × stroke | 98.0 × 39.75 mm |
| Compression ratio | 13.3:1 |
| Rod/stroke ratio | 2.570 |
| Peak power | 755 bhp @ 19,250 rpm |
| Peak torque | 214.4 lb·ft (290.7 N·m) @ 17,000 rpm |
| Engine weight | 95 kg (the rule minimum) |
Displacement (2,399 cc), mean piston speed (25.51 m/s) and BMEP at peak power (14.63 bar) are all computed from those figures rather than published by Cosworth. Correct arithmetic, but not manufacturer data, and we do not present them as such.
Our preset takes the geometry and nothing else. Bore, stroke, compression ratio, vee angle and the resulting displacement match the real engine; the output is something our physics has to produce on its own. It produces 743.19 hp @ 19,250 rpm and 289.64 N·m @ 16,708 rpm, against 755 and 290.7. Peak power is 1.6% light on exactly the right rpm; peak torque is 0.4% light, 292 rpm early.
The CA2006 raced in the Williams FW28, and only in the Williams FW28 — no other 2006 car ran it. It is also, on Bamsey's account, the first Formula One engine to reach 20,000 rpm on track and the highest-revving engine ever raced. No source we could find names the Grand Prix at which it first did it, so we say "in 2006" and stop there.
Why a Short Stroke Buys Breathing
Cutting the stroke does not just protect the pistons. It hands you the bore, and the bore is where the air comes in.
Valve area lives in the roof of the combustion chamber, and the roof is a circle whose diameter is the bore. Two inlet valves in a 98 mm bore have room that two inlet valves in a 70 mm bore do not — Cosworth ran 41.3 mm inlet valve heads with 16 mm of lift. Every extra square millimetre is airflow, and airflow is the binding constraint at 19,000 rpm, where each intake stroke lasts about 1.6 milliseconds.
The chain runs one way:
- Rules cap displacement and cylinder count.
- Maximising bore minimises stroke.
- Short stroke means low piston speed at high rpm — the mechanical permission slip.
- Big bore means large valves — the breathing to actually use those rpm.
- Small displacement per cylinder means light reciprocating parts, so the valvetrain and rods can follow.
An engine that only got step 3 would rev safely and make nothing, because it would suffocate. Cylinder filling — the intake stroke's whole job — has to hold up at the top of the range or the extra revolutions are worthless.
The short stroke helps a third time, on knock. A wide, flat combustion chamber is a poor shape for keeping end gas cool, but at 19,000 rpm the end gas has almost no time to auto-ignite before the flame front reaches it, which is what lets 13.3:1 live on 102 RON. Our model agrees: settled knock at wide-open throttle above 6,000 rpm reads 0.001 on a scale where 0.35 counts as heavy. Those are simulator calibration numbers rather than a real engine's, but the mechanism is the one in our guide to engine knock.
What Actually Stops Your Engine
Four things, in roughly this order.
Piston speed. Covered above, and it is the one that scales purely with geometry. A long-stroke engine hits the wall early no matter what you spend.
Friction. Friction power rises with piston speed, so a high-revving engine pays for its rpm twice: once in mechanical stress and once in horsepower it never gets to the flywheel. Our model charges friction on mean piston speed for exactly this reason, and the CA2006 preset is fitted to 4.33 bar of friction mean effective pressure at 19,250 rpm — a simulator calibration figure. It is also why the −72 N·m result at the top of this article happened.
Knock. High rpm actually helps here, which is counterintuitive until you remember that detonation needs residence time. What hurts is high load at low rpm, which is what makes the CA2006 an awkward engine to launch.
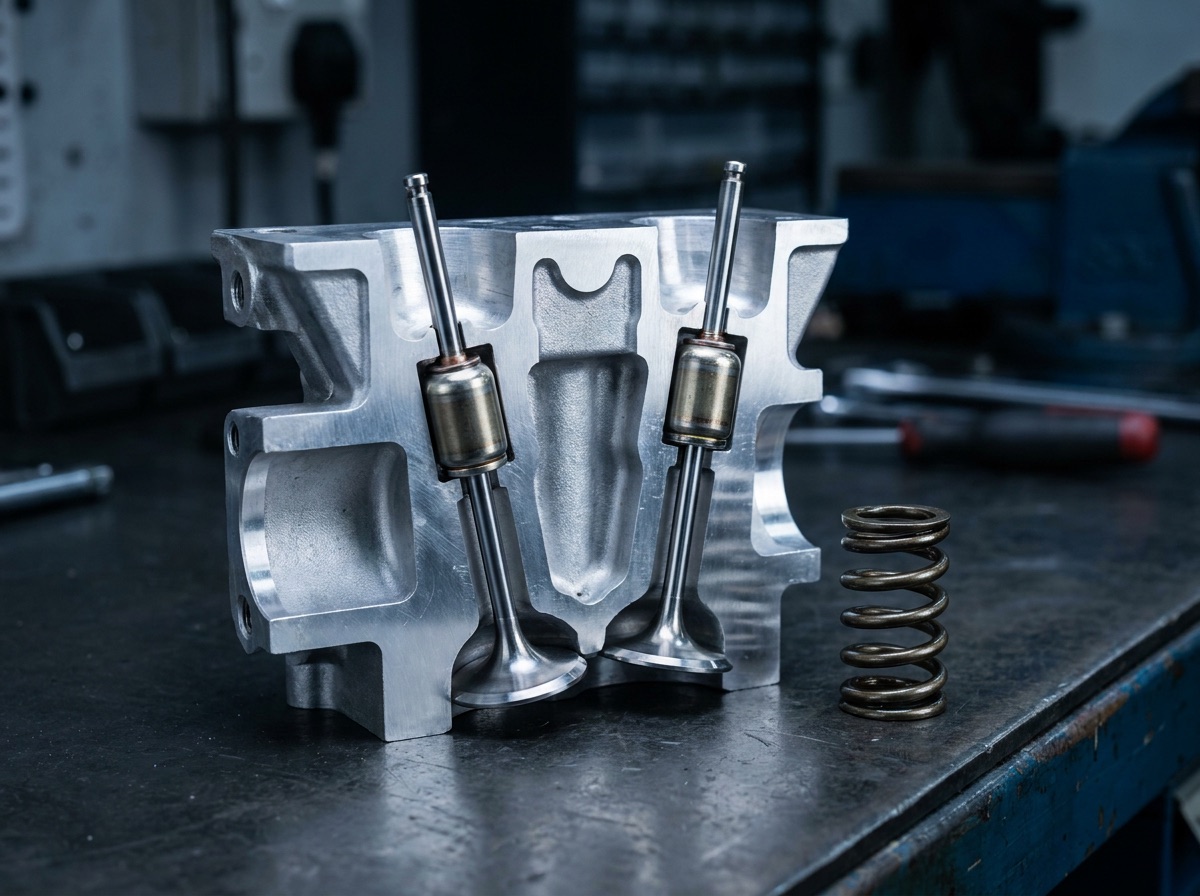
Valvetrain, and a spark map. F1 solved the first with pneumatic valve springs; steel springs surge and float long before 19,000 rpm. The second we have not solved, and it is worth being blunt: our model has a single ignition timing value for every rpm and every load, where a real engine advances and retards continuously. A value fitted at the power peak is therefore wrong at a standing start. At 25° before top dead centre the engine makes its best top-end power and logs "Heavy knock! Power derated" on every launch. At the shipped 20°, launch knock settles to 0.232 at 4,500 rpm and 0.130 at 5,000, and peak power falls from 780.6 hp to 743.2. We took the launch. A real spark map is the fix, and we do not have one yet.
What Our Model Cannot Tell You
With the rev limiter disabled in our test harness — there is no switch for this in the app — the CA2006 free-revs to 41,125 rpm in twenty seconds and is still climbing.
That is not a claim about F1 engines. It is a confession about our physics. In the real world an engine at twice its rated speed disassembles itself: rods let go, valves meet pistons, the crank goes out of balance and stays there. Our model knows about gas exchange, combustion and friction, and friction alone is not enough to stop this engine. The rev limiter is what stops it. With the limiter on it holds a 19,043–19,683 rpm band against a 19,250 redline, which is the behaviour you see on screen.
So read everything here as a statement about airflow, combustion and friction — the part a real dyno measures — and not about mechanical survival, which is the part that actually sets a redline. Mean piston speed is the bridge between the two, and it is arithmetic anyone can check.
Try It in the Simulator
Load the F1 V8 2.4L and do two things.
First, hold wide-open throttle and watch the tachometer reach 19,250. Then look at the torque figure: 290 N·m from 2.4 litres is a thoroughly ordinary road-car number. All 755 horsepower of the real engine is in the rpm, not the twist.
Second, watch the knock indicator at both ends of the range. Roll onto full throttle from idle and hold around 4,500 rpm: the reading settles near 0.232. Take the same engine above 6,000 rpm at full throttle and it falls to 0.001, effectively nothing. Those are simulator calibration values on our own 0-to-1 scale, where 0.35 trips the heavy-knock warning, and they are the model's version of a real effect — the faster the engine turns, the less time the end gas has to detonate.
Both are repeatable and neither needs a spec edit. For the contrast, run a 7.0-litre pushrod V8 next: same eight cylinders, same 90° vee, nearly three times the displacement, and a redline 12,250 rpm lower. The whole roster is at /engines.
Frequently Asked Questions
Why did F1 ban high revs?
Cost and reliability. A mandatory 19,000 rpm rev limiter arrived for 2007, the season after the CA2006 ran, and the limit later fell to 18,000 rpm — Cosworth re-tuned the same engine as the CA2010 to suit (Wikipedia, Cosworth TJ / CA engine). Engines living near their material limits need constant rebuilding, and the sport wanted longer engine lives on fewer units per season.
What limits a road car engine's redline?
Mean piston speed first, then valvetrain dynamics, then cost. Production rods, cast pistons and steel valve springs have to survive 200,000 miles rather than 1,500 km, so a road engine is given a redline that keeps piston speed comfortably below what a race engine accepts — the 23.7 m/s the LS7 computes to at 7,000 rpm is already at the aggressive end for a production V8. Stroke is the dominant term, and a long-stroke engine built for low-rpm torque cannot be revved out of the problem.
Is 20,000 rpm the record?
For a raced engine, yes on the best available account: Ian Bamsey describes the Cosworth CA of 2006 as the first Formula One engine to attain 20,000 rpm on track, and holds that no rival surpassed it before rev limiting was imposed. Plenty of smaller machines — model aircraft two-strokes, turbochargers, gas turbines — spin far faster. Among engines that have raced with a crankshaft driving wheels, this is the high-water mark.
Do today's F1 engines rev that high?
No. The current formula is a turbocharged 1.6-litre V6 hybrid, built around a roughly even split between combustion and electrical power (Motor Sport Magazine). Turbocharged engines make power from pressure rather than revolutions, so the rpm ceiling stopped being the interesting number. The campaign to bring naturally aspirated V10s back is real and has been discussed at FIA level (RaceFans, 21 March 2025), but nothing has been adopted.
Could you fit a shorter-stroke crank to a road engine?
Not usefully on its own. Shortening the stroke cuts displacement, which costs torque everywhere, and the head you already own has the valve area it has — so you lose capacity without gaining the breathing that makes the extra rpm worth having. F1 gets the trade because head, bore, valves, rods and springs were all designed around the same short stroke from the start.
How These Numbers Were Made
What is published, what is computed, what is ours. Bore, stroke, compression ratio, rod/stroke ratio, the peak power pair, the peak torque pair and engine weight are Cosworth's own figures, underlined as such in Note 108. Displacement, mean piston speed and BMEP are the note author's arithmetic on those figures — correct, but not manufacturer data, and we label them computed everywhere they appear. The firing order was never published for this engine and the flat-plane crank is a secondary-source fact, so neither is claimed here or in the preset.
How the preset was validated. Note 108 reproduces the only published nine-point power curve behind any engine in our roster, 16,000 to 20,000 rpm. We measured against every point, held at each speed until it settled, rather than checking peak power alone — a curve peaking at 13,000 rpm can hit 755 hp at 19,250 and still be completely wrong in shape.
| rpm | Published | Measured | Δ |
|---|---|---|---|
| 16,000 | 614 hp | 645.2 | +5.1% |
| 17,000 | 694 | 689.3 | −0.7% |
| 18,000 | 731 | 720.7 | −1.4% |
| 18,500 | 744 | 731.4 | −1.7% |
| 18,750 | 750 | 735.7 | −1.9% |
| 19,000 | 754 | 738.2 | −2.1% |
| 19,250 | 755 | 740.7 | −1.9% |
| 19,500 | 747 | 741.2 | −0.8% |
| 20,000 | 711 | 740.4 | +4.1% |
Eight of nine points sit inside 5%, and the ninth misses by 0.1 percentage points. The committed peak figures — 743.19 hp and 289.64 N·m — come from a continuous 24-step sweep, which reads about 0.3% above the held-point table. Our model does not fall away at the top the way the published curve does, and we have deliberately not narrowed a breathing constant to close that gap: fitting a physical parameter to a residual with no independent measurement behind it is how a model stops describing anything.
Nothing below 16,000 rpm is published, so nothing this article says about that part of the range is validated against Cosworth.
Every figure runs at 1.000 bar and 293 K dry, which is our reference day, and is compared to the SAE-corrected published number without a second correction. The dyno correction calculator explains why applying one twice invents a shortfall that is not there.
About this article
Written by the Engine Simulator Team, who build and calibrate the physics behind these numbers. We publish the model's limits beside its results, because a simulated figure is worth nothing without them. Found an error? Send it to us.
Sources and Further Reading
- Note 108: Cosworth 2006 Type CA Series 6 — Ian Bamsey, grandprixengines.co.uk. The primary source for every published figure here; marks manufacturer-supplied data as underlined, and carries the nine-point power curve.
- 2006 Formula One Technical Regulations — FIA, 15 December 2005. Articles 5.1.2 (capacity), 5.1.4 (eight cylinders, 90° V), 5.4.1 (98 mm bore), 19.3 (fuel, RON 95.0–102.0).
- Cosworth TJ / CA engine — Wikipedia, retrieved 2026-09-01. The 2007 19,000 rpm limiter and the 18,000 rpm CA2010.
- Williams FW28 — Wikipedia, retrieved 2026-09-01. The only 2006 car to race the CA2006.
- Why F1 Engines Can't Rev Past 20,000 RPM — Driver61, on pneumatic valves, oversquare geometry and the material limits.
- Mark Hughes: why F1's 50/50 hybrid rules were doomed by conflicting priorities — Motor Sport Magazine, July 2026.
- Sudden switch back to V10 engines would be "a bit of a head-scratcher" for F1 — RaceFans, 21 March 2025.
Related Reading
- How a four-stroke engine works — the cycle the CA2006 runs, 1,283 combustion events a second across eight cylinders at 19,250 rpm.
- What is engine knock — why residence time matters more than compression, and why 13.3:1 on 102 RON works at 19,000 rpm and not at 4,500.
- The Otto cycle explained — where compression ratio turns into thermal efficiency, and what 13.3:1 buys.
- How a turbocharger works — the other route to power density, and the one modern Formula One took instead.