The Otto Cycle Explained: Thermodynamics of the Gasoline Engine
The Otto cycle is the thermodynamic blueprint every gasoline engine follows: four strokes, two isentropic processes, two constant-volume heat exchanges. Here's how efficiency, compression ratio, and knock connect.
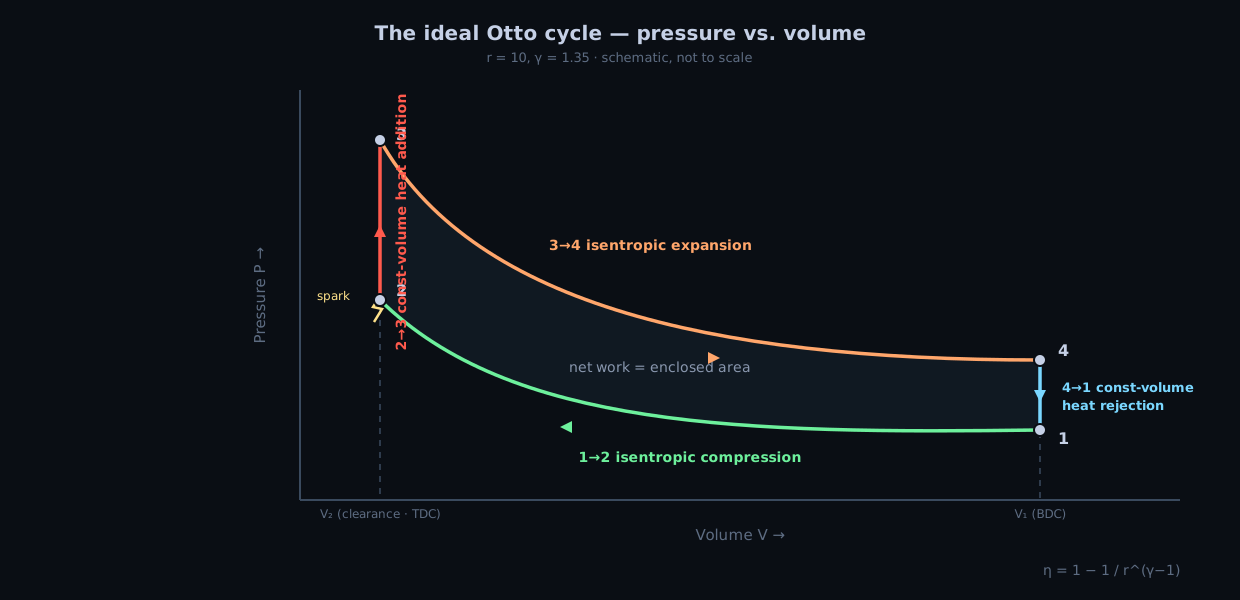
Every gasoline engine in every car, motorcycle, and generator follows the same thermodynamic script. Nikolaus Otto codified it in 1876. The script has four acts, two of which do work and two of which set up for the next cycle. Understanding it unlocks why compression ratio matters, why high-octane fuel exists, and exactly where engine efficiency comes from — and where it stops.
What Is the Otto Cycle?
The Otto cycle is an idealized thermodynamic cycle describing how a spark-ignition piston engine converts chemical energy into mechanical work. "Idealized" means it strips away friction, heat loss through cylinder walls, and the messy gas dynamics of real valves — leaving only the core thermodynamic logic.
It consists of four processes operating on a fixed mass of gas trapped in a cylinder:
| Process | Strokes | What happens |
|---|---|---|
| 1→2 Isentropic compression | Compression stroke | Piston rises, gas compressed adiabatically — no heat exchange, entropy constant |
| 2→3 Isochoric heat addition | Power stroke (ignition) | Spark fires, fuel burns, pressure spikes at constant volume |
| 3→4 Isentropic expansion | Power stroke (expansion) | Hot gas pushes piston down — again adiabatic |
| 4→1 Isochoric heat rejection | Exhaust/intake | Burned gas exhausted, fresh charge taken in — modeled as constant-volume pressure drop |
"Isentropic" means adiabatic and reversible — no friction, no heat leak. "Isochoric" means constant volume — the piston isn't moving during heat exchange.
Real engines violate all of these idealizations. The value of the Otto cycle is not accuracy — it's that it correctly predicts the direction of every efficiency trade-off and gives a clean analytical formula for why compression ratio is the dominant lever.
The Efficiency Formula
Thermal efficiency of the ideal Otto cycle depends on exactly one variable: compression ratio.
η = 1 − 1 / r^(γ − 1)
Where:
- r = compression ratio (swept volume + clearance volume) / clearance volume
- γ = ratio of specific heats (Cp/Cv) ≈ 1.35 for a gasoline-air mixture
At r = 10: η = 1 − 1/10^0.35 ≈ 59%. At r = 13: η ≈ 65%. Real engines capture roughly half of that ideal — typically 30–40% brake thermal efficiency — because of the losses the ideal cycle ignores. But the shape of the curve is right: compression ratio pays diminishing returns past about 12–13, and the gains steepen sharply below 8.
Try It: Live Otto Cycle
The chart below is a real simulation — the engine is actually running. Drag the compression ratio slider and watch the P-V loop stretch upward. A higher loop encloses more area, which is more work extracted per cycle. The ideal efficiency number updates in real time.
CYLINDER 1 THERMO
in-cylinder pressure, live
Ideal Otto efficiency η = 1 − 1/rγ−1 (γ = 1.35). Drag the CR slider to see how compression ratio drives efficiency — and where knock limits the gain.
Notice what happens above CR 13: the loop shape becomes harder to sustain without knock — in a real engine, the end gas would autoignite before the flame front arrives, collapsing the controlled burn into a destructive pressure spike. The ideal cycle has no knock model; real engines do. That's the ceiling.
The Four Processes in Detail
1→2: Isentropic Compression
The piston rises from bottom dead center (BDC) to top dead center (TDC) with both valves closed. No heat enters or leaves — the work of compression goes entirely into raising the gas temperature and pressure.
The temperature ratio across compression is:
T₂ / T₁ = r^(γ − 1)
At r = 10 and an intake temperature of 300 K: T₂ ≈ 300 × 10^0.35 ≈ 672 K. The gas entering the cylinder at 27°C leaves the compression stroke at nearly 400°C — before combustion begins. This is why diesel engines can ignite fuel without a spark: push compression to 16:1 and T₂ exceeds 800 K, above any fuel's autoignition temperature.
2→3: Isochoric Heat Addition
The spark fires just before TDC. In the ideal cycle, all the fuel's chemical energy is released instantaneously at constant volume — the piston doesn't move during combustion. In reality, the flame front takes a few milliseconds to sweep the chamber, which is why ignition timing is calibrated to center the pressure rise near TDC rather than at it.
The pressure ratio across combustion:
p₃ / p₂ = T₃ / T₂
Peak cycle temperature T₃ runs 2,000–2,800 K in a real engine. This is the thermodynamic constraint on exhaust emissions: NOₓ formation accelerates above roughly 1,800 K, which is why EGR, lean burn, and cooled charge strategies all aim at limiting T₃.
3→4: Isentropic Expansion
The high-pressure, high-temperature gas drives the piston back to BDC. This is the only stroke that delivers work to the crankshaft. The expansion is adiabatic in the ideal cycle — all the enthalpy of the gas converts to mechanical work.
The expansion ratio equals the compression ratio in the symmetric Otto cycle. This symmetry is the source of a real inefficiency: exhaust valve opening happens before BDC, releasing blowdown energy that hasn't been fully converted to work. Atkinson-cycle and Miller-cycle engines break the symmetry by using a longer expansion stroke than compression stroke, recovering some of that blowdown.
4→1: Isochoric Heat Rejection
In the ideal model, the piston reaches BDC and pressure drops back to atmospheric at constant volume as heat is "rejected" to the environment. In the real engine this is the exhaust and intake strokes — the two gas-exchange strokes that the ideal cycle collapses into a single step.
The rejected heat Q_out is what leaves through the exhaust pipe as heat, and the fraction that doesn't leave is what becomes useful work. Efficiency is simply:
η = 1 − Q_out / Q_in = 1 − T₁/T₂ = 1 − 1/r^(γ−1)
The two expressions are identical — the compression ratio formula is just the temperature ratio in disguise.
Why Compression Ratio Has a Ceiling
The ideal cycle says higher compression ratio always improves efficiency. Real engines cap out at 12–13:1 for gasoline because of knock — the spontaneous autoignition of the end gas ahead of the flame front.
End-gas temperature at the point of ignition is approximately:
T_endgas ≈ T_intake × (p_cylinder / p_intake)^((γ−1)/γ)
Gasoline's autoignition threshold is roughly 700–750 K (depending on octane rating). At CR 10.5, a typical engine clears that threshold with a margin of around 20 K on a cool day. At CR 14, that margin is gone. The end gas detonates, pressure oscillates at 5–9 kHz, and those oscillations strip the protective boundary layer from the piston crown and cylinder walls.
Octane rating is simply a measure of how high that threshold sits. 95 RON raises the threshold by roughly 3.5 K per octane point relative to a 95 baseline. Compression ratio, intake temperature, boost pressure, and ignition advance timing all push T_endgas toward the threshold from the other direction. The ECU's knock feedback loop lives in that margin — advancing timing for efficiency, retreating when knock sensors detect the characteristic ring.
For a deeper look at the knock mechanism, see What Is Engine Knock? Causes, Sounds, and How to Stop It.
Real Otto vs. Ideal Otto
The gap between ideal (59% at CR 10) and real (30–35% brake) efficiency comes from losses the cycle ignores:
| Loss | Typical magnitude |
|---|---|
| Heat transfer through cylinder walls | 6–8 percentage points |
| Combustion phasing (finite burn duration, non-constant volume) | 4–6 pp |
| Gas exchange pumping work | 2–4 pp |
| Friction (rings, bearings, accessories) | 4–6 pp |
| Incomplete combustion / crevice volumes | 1–2 pp |
| Blowdown before EVO | 1–2 pp |
The most recoverable losses in modern engine development are combustion phasing (direct injection, cooled EGR, variable compression) and pumping work (cylinder deactivation, Atkinson cycle, variable valve timing). Heat transfer losses are largely the cost of having a piston — they're why ceramic thermal barrier coatings show up in racing and heavy-diesel applications.
From Otto Cycle to Real Dyno Curve
The ideal cycle predicts efficiency but not power. Actual power output depends on how much air the engine can move per cycle — volumetric efficiency — which peaks at a specific RPM set by intake runner resonance. Below that RPM, the runners don't charge effectively. Above it, gas velocity and valve timing limit filling.
The result: torque peaks where volumetric efficiency peaks (typically 3,000–5,000 RPM for naturally-aspirated engines), and power continues rising past that because more cycles per second outweighs declining torque — until volumetric efficiency collapses and both fall together. You can watch exactly this in the engine simulator: run a dyno sweep on the I4 and the inflection point in the torque curve tracks the runner tuning.
Otto Cycle FAQs
Why doesn't the ideal cycle have an intake or exhaust stroke?
The ideal cycle models only the thermodynamic conversion of heat to work, not the gas-exchange machinery. Intake and exhaust are treated as a single isochoric heat rejection (4→1) — the math works out the same as if the burned gas teleported out and fresh charge teleported in at BDC.
What's the difference between the Otto cycle and the Diesel cycle?
The Diesel cycle uses isobaric (constant-pressure) heat addition instead of isochoric (constant-volume). Because injection and combustion happen over a finite crank travel rather than at TDC, the pressure stays roughly constant while the piston moves. At the same compression ratio, the Diesel cycle is slightly less efficient than Otto — but diesel engines use much higher CR (16–23:1) than gasoline engines can, which is why diesel thermal efficiency (40–45%) beats gasoline (30–35%) in practice.
What is the Atkinson cycle and how does it differ?
The Atkinson cycle uses a longer expansion stroke than compression stroke — breaking the symmetry of the Otto cycle. More of the gas enthalpy converts to work before exhaust valve opening, improving efficiency at the cost of lower peak power density. Modern hybrids (Toyota Prius, for instance) run a modified Atkinson cycle using late intake valve closing to reduce effective compression while keeping a long expansion stroke.
What does γ actually represent?
γ = Cp/Cv is the ratio of specific heats at constant pressure and constant volume. For a diatomic gas (air, roughly) γ ≈ 1.4. A fuel-air mixture with higher molecular complexity runs slightly lower (≈ 1.3–1.35) because combustion products (CO₂, H₂O) have more degrees of freedom. The value matters for efficiency: higher γ means a steeper compression temperature rise and more work extracted per unit compression.
Why does ignition timing affect efficiency?
The ideal cycle assumes instantaneous combustion at TDC. Real flame propagation takes time, so if you fire the spark at TDC the pressure peak arrives well after, when the piston has already descended — you've lost the leverage of the crank at its most efficient angle. Advancing timing centers the pressure rise at TDC, extracting more work. Advance too far and you're compressing an already-burning charge, raising T_endgas and causing knock.