8 Engine Experiments for the Classroom (No Dyno Required)
Compression ratio, knock, torque vs power, boost — eight reproducible experiments built on a free browser simulator, each with the measured numbers and an honest note on where the model and reality part ways.

A real engine dynamometer costs more than most school departments will ever see, and even a simple teaching engine needs fuel, oil, ventilation, and someone qualified to run it safely. None of that is available to most physics and engineering classrooms — but the questions those tools would answer are exactly the ones a thermodynamics syllabus asks. A browser-based engine simulator cannot replace a real dyno cell. It can, at zero cost and zero risk, let a class run the actual experiment instead of reading about it.
This is eight of them, each reproducible from a link, each reporting the exact number the simulator gave when this article was measured, and each honest about where the model's answer and the textbook's answer disagree — because that disagreement is itself worth teaching.
Key Takeaways
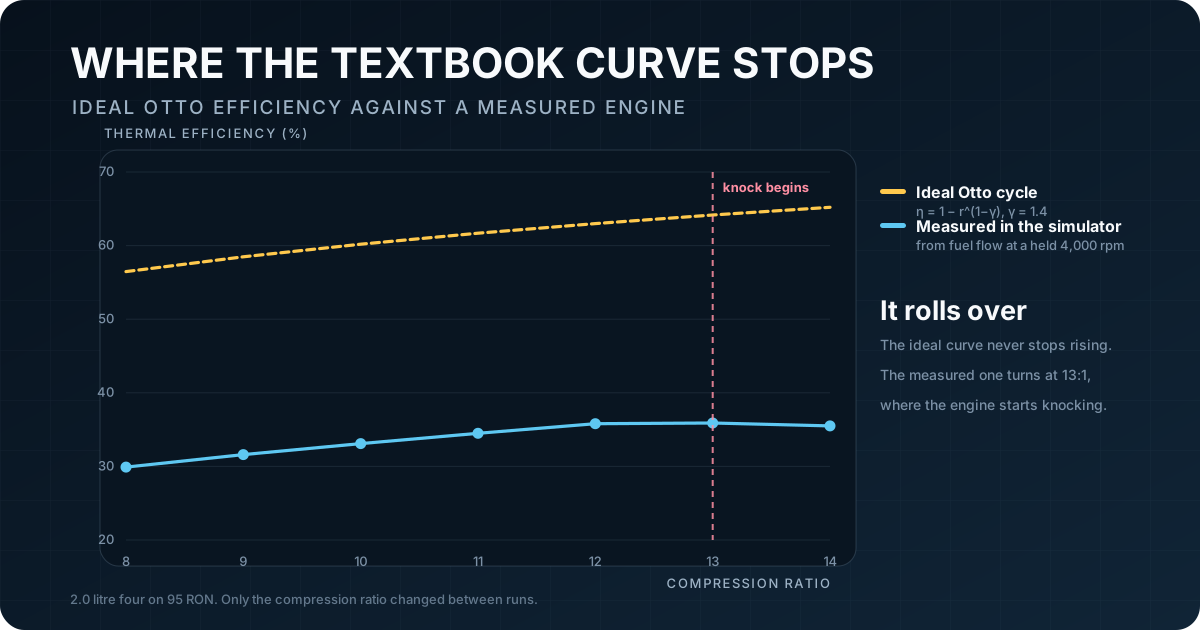
- Compression ratio against efficiency tracks the ideal Otto relation in shape but not in magnitude — measured brake efficiency rose from 29.9% to 35.9% across compression ratios 8–13, well under the ideal cycle's 56.5–64.2%, and then rolled over. The ideal relation never rolls over; a knock ceiling is why the real curve does.
- The knock ceiling is measurable directly and independently of the efficiency curve — torque on 95 RON petrol stops climbing at exactly the same compression ratio the efficiency curve turns over at.
- Torque and power are one measured curve, not two:
P = T·ωreproduced the horsepower column from the torque column to within rounding on every engine checked.- Displacement is linear with power to within 0.7% across a 2.5x range on the same architecture — the cleanest, most textbook-matching result in this set.
- Splitting a fixed 2.0 litres across 2, 3, 4, 6 or 8 cylinders bought 1.0% more peak power. Cylinder count is not a power lever at fixed displacement.
On this page: Compression ratio and efficiency · The knock ceiling · Torque and power · Displacement · Fires per revolution · Boost and the knock gate · Spark vs compression ignition · Cylinder count · Where this maps onto a syllabus · Does simulation actually teach · FAQ · How these numbers were made
Experiment 1: Compression Ratio and Efficiency
The air-standard Otto cycle gives a clean, closed-form prediction for how compression ratio should affect thermal efficiency:
eta = 1 - r^(1 - gamma) (gamma = 1.4 for air)
Sweeping compression ratio on a 2.0 litre four and reading efficiency back from measured fuel consumption. The measured column is this simulator's own output at a held 4,000 rpm, with only the compression ratio changed between runs — it is not a figure quoted from any published engine:
| Compression ratio | Ideal η | Measured η |
|---|---|---|
| 8 | 56.5% | 29.9% |
| 10 | 60.2% | 33.1% |
| 12 | 63.0% | 35.8% |
| 13 | 64.2% | 35.9% (peak) |
| 14 | 65.2% | 35.5% |
Three things worth a class discussion, all visible in one chart:
- The shape is right. Efficiency rises with compression ratio, with diminishing returns per additional ratio point, exactly as the ideal relation predicts.
- The magnitude is not. The ideal cycle assumes no heat loss, no friction, no gas-exchange work and instantaneous combustion — none of which a real (or realistically simulated) engine gets. A measured brake efficiency in the low thirties for a petrol engine is realistic; the gap between it and 56%+ is the honest cost of every assumption the ideal cycle waives away.
- The real curve turns over. The ideal curve never does. That is not noise — it is a second, independent physical limit intruding on the first. Experiment 2 measures it directly.
Where the model's sensitivity itself is honest and where it is not: below the point where knock intrudes, this simulator's efficiency gain per unit of compression is somewhat steeper than the ideal Otto relation predicts (roughly 20% measured against roughly 11.5% ideal, moving from CR 8 to CR 12). Teach the shape and the ceiling from this experiment — both are correct and reproducible. Treat the exact slope as this simulator's calibration, not a universal number.
Experiment 2: The Knock Ceiling
The same 2.0 litre four, held at 5,000 rpm wide-open throttle. That speed is near where volumetric efficiency peaks, which is where knock is worst on this engine. Knock intensity is read as its peak over a several-second window, because it is a decaying signal — a single instantaneous sample can read zero even while the engine is knocking:
| Compression ratio | 95 RON knock | Torque |
|---|---|---|
| 10 | 0.000 | 161.1 N·m |
| 12 | 0.000 | 174.8 N·m |
| 13 | 0.030 | 179.1 N·m |
| 14 | 0.119 | 178.4 N·m |
Torque stops climbing between compression ratios 13 and 14 — 179.1 down to 178.4 N·m — at exactly the compression ratio where Experiment 1's efficiency curve also turned over. The two experiments, run independently on different measured quantities, corroborate each other: raising compression ratio past a fuel-dependent ceiling stops helping and starts costing, because the engine has to retard or otherwise derate its combustion to avoid detonation.
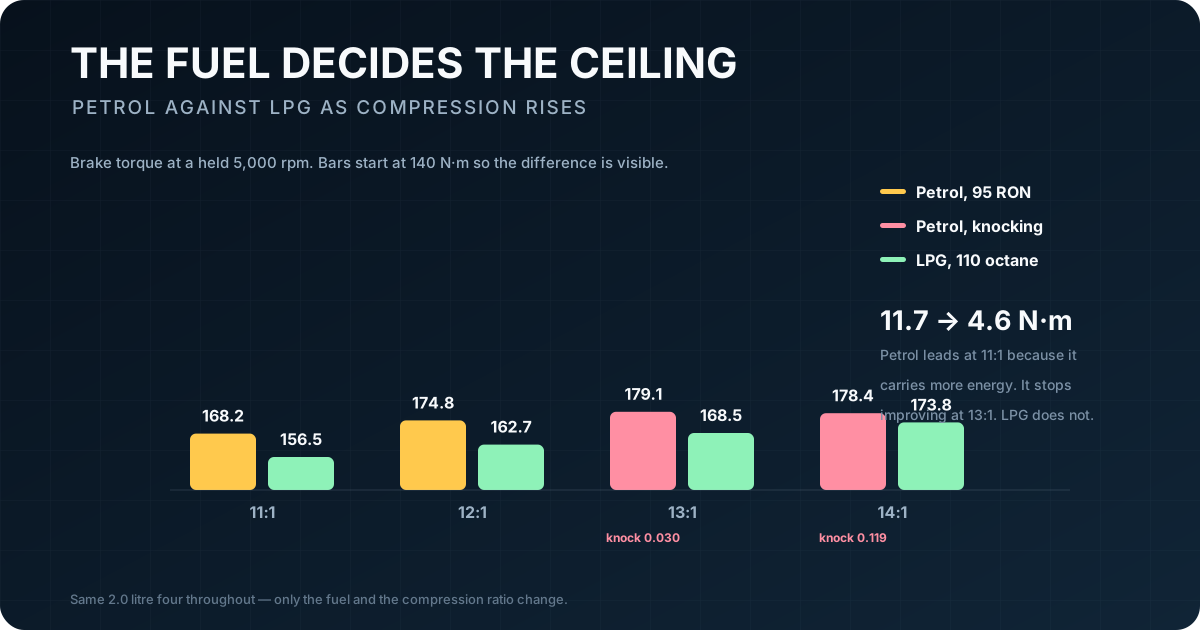
A reader-reproducible version. Octane is not an editable field in the simulator's spec panel — it is fixed per fuel type rather than a slider — so a class cannot dial in "98 RON" directly. Switching fuel type to LPG (110 octane against petrol's 95) reproduces the same crossover with a control any reader can actually operate:
| Compression ratio | Petrol torque | LPG torque |
|---|---|---|
| 11 | 168.2 N·m | 156.5 N·m |
| 13 | 179.1 N·m (knocking) | 168.5 N·m (no knock) |
| 14 | 178.4 N·m (knocking) | 173.8 N·m (no knock) |
Petrol leads at compression ratio 11 by 11.7 N·m, because it carries more energy per unit of charge. It then stops improving once it starts knocking, while LPG — which tolerates far more compression before it detonates — keeps climbing, and the gap closes to 4.6 N·m by compression ratio 14. The better fuel in this comparison is not the one with more energy in it. It is the one that lets the engine be built to use its energy well.
Experiment 3: Torque and Power Are One Curve
A recurring student confusion is treating torque and power as two independent engine properties, sometimes with a mistaken belief that a "torquey" engine and a "powerful" engine are different kinds of thing. They are the same measurement, related by one equation:
P = T * omega
| Peak torque | Peak power | Gap | Torque at the power peak |
|---|---|---|---|
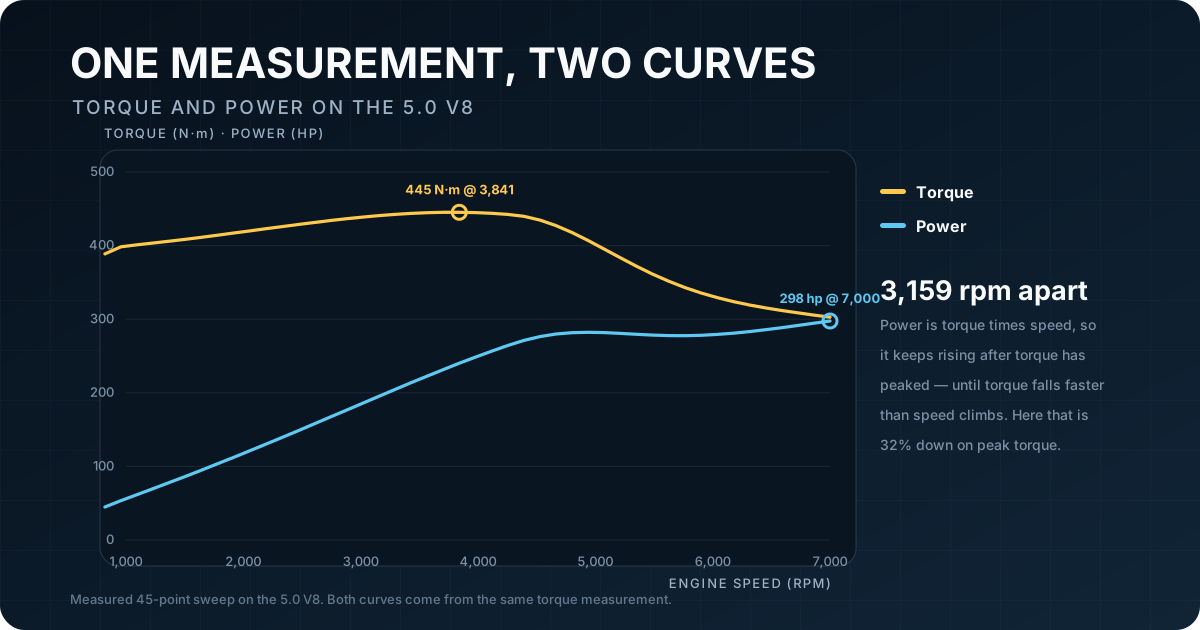
| 445.2 N·m @ 3,841 rpm | 297.6 hp @ 7,000 rpm | 3,159 rpm | 302.7 N·m (−32.0%) |
Power keeps rising for thousands of rpm after torque has already started falling, purely because engine speed is climbing faster than torque is dropping — until, past the power peak, it isn't. A student can verify P = T·ω from this single measured curve with a calculator: multiply the torque column by the engine-speed column (in the right units) and the horsepower column falls out.
Experiment 4: Does Displacement Scale Linearly With Power?
Bore scaled on one architecture, nothing else touched:
| Bore | Displacement | Peak power | hp per litre |
|---|---|---|---|
| 70.0 mm | 1.324 L | 76.9 hp | 58.1 |
| 90.0 mm | 2.188 L | 126.7 hp | 57.9 |
| 110.0 mm | 3.269 L | 188.8 hp | 57.7 |
Power tracks displacement to within 0.7% across a 2.5x range in swept volume — the cleanest, most textbook-matching result in this whole set. Specific output (power per litre) drifts down very slightly as displacement rises, because friction losses scale with cylinder bore area while power-generating capacity scales with swept volume — a genuine, small, real-engine effect that survives even in a simplified simulation.
Experiment 5: One Power Stroke per Revolution, or per Two?
The identical 249 cc cylinder, run as a two-stroke and then as a four-stroke:
- Two-stroke: 45.0 hp @ 8,151 rpm
- Four-stroke: 19.1 hp @ 7,178 rpm
- Ratio: ×2.35
A two-stroke fires every crank revolution instead of every other one, so the naive prediction is double the power at equal displacement. The measured ratio here is higher than 2x, not lower — the full mechanism (why it is not exactly 2x on every engine, and where the real losses live) is the subject of a dedicated two-stroke versus four-stroke measurement built on the same method. A reader-reproducible version needing no spec editing: the shipped 249 cc two-stroke single against the shipped 499 cc four-stroke single — half the displacement, 62% more power, and peak torque within 1.5% of each other.
Experiment 6: Why a Turbo Can Be Refused
Whether a turbocharger is offered to a given engine is decided by the same knock ceiling Experiment 2 measures, applied to boost pressure instead of compression ratio. The table below reads that decision through the simulator's own fit-decision function, rather than forcing the part on:
| Engine | Compression ratio | Fuel | Knock ceiling | Turbo | Blower |
|---|---|---|---|---|---|
| 2.0 four | 10.5:1 | 95 RON | 1.178 bar | offered — 146.9 hp (+27.0%) | offered |
| 3.0 boxer six | 10.5:1 | 95 RON | 1.150 bar | offered — 235.1 hp (+24.3%) | offered |
| 5.0 V8 | 10.8:1 | 95 RON | 1.103 bar | REFUSED | offered |
| 7.0 V8 | 11.0:1 | 98 RON | 1.140 bar | REFUSED | offered |
The interesting pair is the last two: both are refused a turbocharger and both are offered a supercharger, at essentially the same knock ceiling. The mechanism is that a wastegate-controlled turbo runs a standing pressure error above its own set point — it can overshoot the ceiling it was aimed at — while a belt-driven supercharger simply lands on a hard pressure cap it cannot exceed. The refusal is not a missing feature; it is the model correctly declining to offer a part that would detonate the engine, and the two-machine comparison shows why the same knock physics produces two different verdicts for two different induction devices.
Experiment 7: Spark Ignition Against Compression Ignition
Two engines of nearly identical displacement, one built around each ignition strategy:
| Petrol (spark) | Diesel (compression) | |
|---|---|---|
| Compression ratio | 10.5:1 | 17.5:1 |
| Ignition | spark plug | compression heat |
| Throttle | butterfly plate | fuel rack, no plate |
| Displacement | 2.00 L | 1.99 L |
| Peak power | 115.7 hp @ 4,942 rpm | 70.1 hp @ 4,811 rpm |
| Peak torque | 179.7 N·m @ 3,954 rpm | 151.9 N·m @ 2,356 rpm |
The architectural differences are correctly represented — the diesel's much higher compression ratio (no spark needed if the charge is hot enough to self-ignite from compression alone), the absence of a throttle plate (a diesel meters power by fuel quantity, not by restricting air), and torque arriving 1,600 rpm lower down.
This one experiment carries a real caveat, and a class should be told it plainly. This simulator's diesel fuelling is calibrated close to the same air-fuel ratio as its petrol engines, when a real diesel runs substantially leaner — which is a large part of how a real diesel's higher compression ratio earns back its efficiency advantage. The architectural comparison above is sound. The efficiency comparison between these two specific presets is not, and should not be drawn from this experiment.
Experiment 8: Cylinder Count at Fixed Displacement
2.0 litres held exactly constant, bore adjusted, redline held fixed:
| Cylinders | Displacement | Peak power | Peak torque |
|---|---|---|---|
| 2 | 2.000 L | 115.1 hp | 178.5 N·m |
| 4 | 2.000 L | 115.8 hp | 179.9 N·m |
| 8 | 2.000 L | 116.2 hp | 180.5 N·m |
Splitting the same swept volume eight ways instead of two buys 1.0% more peak power. Cylinder count is not, at fixed displacement and fixed redline, a meaningful power lever in this measurement. What a class should be pushed to ask next is exactly what this experiment deliberately held fixed: the redline. In a real engine, more and smaller cylinders means lighter reciprocating parts, which is what actually lets a real high-cylinder-count engine turn faster and make more power — a mechanism this controlled comparison does not include on purpose, precisely so it can isolate the one variable it claims to isolate.
Where This Maps Onto a Syllabus
These experiments are built to answer real course content, not to be generically "STEM-adjacent." Two concrete hooks:
- A-level physics thermodynamics. AQA's Physics A-level specification carries a dedicated Thermodynamics and Engines topic covering indicated and brake power, mechanical efficiency, and heat-engine cycle analysis — Experiments 1, 2 and 3 exercise exactly that content with a real, adjustable engine instead of a static diagram.
- University thermodynamics. Air-standard and cold-air-standard cycle analysis — the assumptions Experiment 1's ideal-Otto line rests on — is standard first-year engineering thermodynamics coursework, and the gap this article measures between that idealisation and a modelled real engine is itself a natural tutorial-question extension.
- Octane and fuel chemistry. Research Octane Number and Motor Octane Number are standard fuels-and-combustion syllabus content; Experiment 2's petrol-vs-LPG crossover gives that abstract number a directly observable consequence.
Does Simulation-Based Instruction Actually Work?
The honest answer is: interactive, hands-on engagement with a system beats watching it explained, and this is one of the better-replicated results in physics education research rather than an assumption.
Richard Hake's 1998 survey of 6,542 introductory physics students across 62 courses found normalized learning gains of 0.48 for courses using interactive-engagement methods against 0.23 for traditionally taught courses — roughly double, on a standardized mechanics test, from changing how the material was delivered rather than what was covered. Wieman, Adams and Perkins' 2008 paper introducing the PhET simulation project in Science reported the same pattern specifically for interactive simulations, and a more recent meta-analysis of 47 effect sizes across 20 studies found a large overall effect (d = 0.83) for PhET-style simulations against traditional instruction, strongest in abstract domains — which an internal-combustion engine's invisible, moving gas state very much is.
None of that research is about this specific simulator, and this article does not claim it is. What it does claim is narrower and more defensible: the general finding that letting a student manipulate a system and see the consequence beats reading about it, applies to a subject — heat engines — that is unusually hard to make tangible any other way.
Frequently Asked Questions
Do I need any equipment to run these experiments?
No — every experiment on this page runs in a browser, on the free engine simulator, with nothing installed. Several are reproducible directly from a linked preset with no spec editing at all; the rest change one clearly labelled field in the spec panel.
Are the numbers in this article guaranteed to stay the same?
They are frozen to the specific simulator version this article was measured against, and the article says so. Like any simulation used for teaching, treat the mechanism and the shape of the result as the durable lesson, and re-run the linked experiment yourself if you want the current exact figures — that re-running is itself good practice for a class to see.
Is a simulator a substitute for a real engine or dynamometer?
No, and the article does not claim otherwise. A simulator cannot teach the physical handling of fuel, the sound and vibration of a real running engine, or the practical skill of instrumenting a real test. What it can do is let every student individually run an experiment that would otherwise need equipment no school has, and get an immediate, exact, repeatable number back — which is a different and complementary kind of learning.
Where does this simulator disagree with the ideal Otto cycle, and why does that matter for teaching it?
Experiment 1 measures both the agreement (efficiency rises with compression ratio, with diminishing returns) and the disagreement (the ideal cycle's magnitude is far higher than measured, and it never turns over the way the measured curve does past a knock-limited compression ratio). Showing students exactly where a simplified model and a more complete one diverge, and being able to explain why — knock, friction, heat loss, finite combustion time — is arguably a more useful lesson than either curve on its own.
How These Numbers Were Made
- Physical principles hold as stated:
P = T·ω, the ideal Otto relation and its stated assumptions, the existence of a knock-driven compression and boost ceiling, the architectural differences between spark and compression ignition, and firing-frequency scaling between two-stroke and four-stroke operation. - The measured figures are this simulator's output for the specific presets and swept fields named, at the exact conditions stated (rpm, throttle, fuel). They are internally consistent — every comparison in this article changed exactly one variable and held everything else fixed — which is what makes the comparisons trustworthy as teaching results, whether or not the absolute numbers match a specific real engine.
- Known limitations are stated inline at each experiment where the simulator's calibration diverges from a real engine in a way that would mislead if left unsaid — the compression-sensitivity slope in Experiment 1, and the diesel fuelling calibration in Experiment 7.
- Method: 45-point wide-open-throttle dyno sweeps for every power/torque curve; knock intensity read as its peak over a multi-second held-rpm window, because it is a decaying signal that can read zero at a single instant even while the engine is actively knocking; fuel consumption measured with rpm held fixed under load rather than free-revving, since a free-revving engine at redline sits on its limiter with fuel cut.
Sources and Further Reading
- Hake, "Interactive-Engagement versus Traditional Methods: A Six-Thousand-Student Survey of Mechanics Test Data for Introductory Physics Courses," American Journal of Physics 66, 64 (1998) — the interactive-engagement effect-size result Experiment-driven teaching is built on
- Wieman, Adams & Perkins, "PhET: Simulations That Enhance Learning," Science 322, 682 (2008) — the founding research on interactive-simulation-based physics teaching
- Meta-analysis of the effectiveness of PhET simulations in physics education, International Journal of Online and Biomedical Engineering — d = 0.83 overall effect size across 47 measured comparisons
- AQA Physics A-level, Thermodynamics and Engines topic summary — the syllabus content this article's experiments map onto
- University of Waterloo ME354, Ideal Otto Cycle tutorial notes — the air-standard and cold-air-standard assumptions behind Experiment 1's ideal-efficiency line
- Petroleum Equipment Institute, Octane Number — RON and MON definitions behind Experiment 2's fuel comparison
Related Reading
- What is engine knock, and what actually causes it — the full mechanism behind Experiment 2's ceiling
- The Otto cycle explained: thermodynamics of the gasoline engine — the ideal-cycle derivation Experiment 1 measures against
- How a four-stroke engine works — the baseline cycle every experiment above compares against
- Two-stroke vs four-stroke: what actually differs — the full measurement behind Experiment 5
- Browse every engine in the simulator — every preset used in this article, filterable by family, fuel and induction